Latency numbers and estimation tables
How to use this sheet
Memorise the order of magnitude, not the digits. In the room you say ranges ("a same-datacenter round trip is about half a millisecond, cross-region is tens of milliseconds") and you round aggressively (a day is 10^5 seconds). Every estimation on this site uses these tables, so when a case study says "~1.2k writes/s" you can trace the arithmetic back here.
Tables
Latency ladder (2020s hardware, order of magnitude)
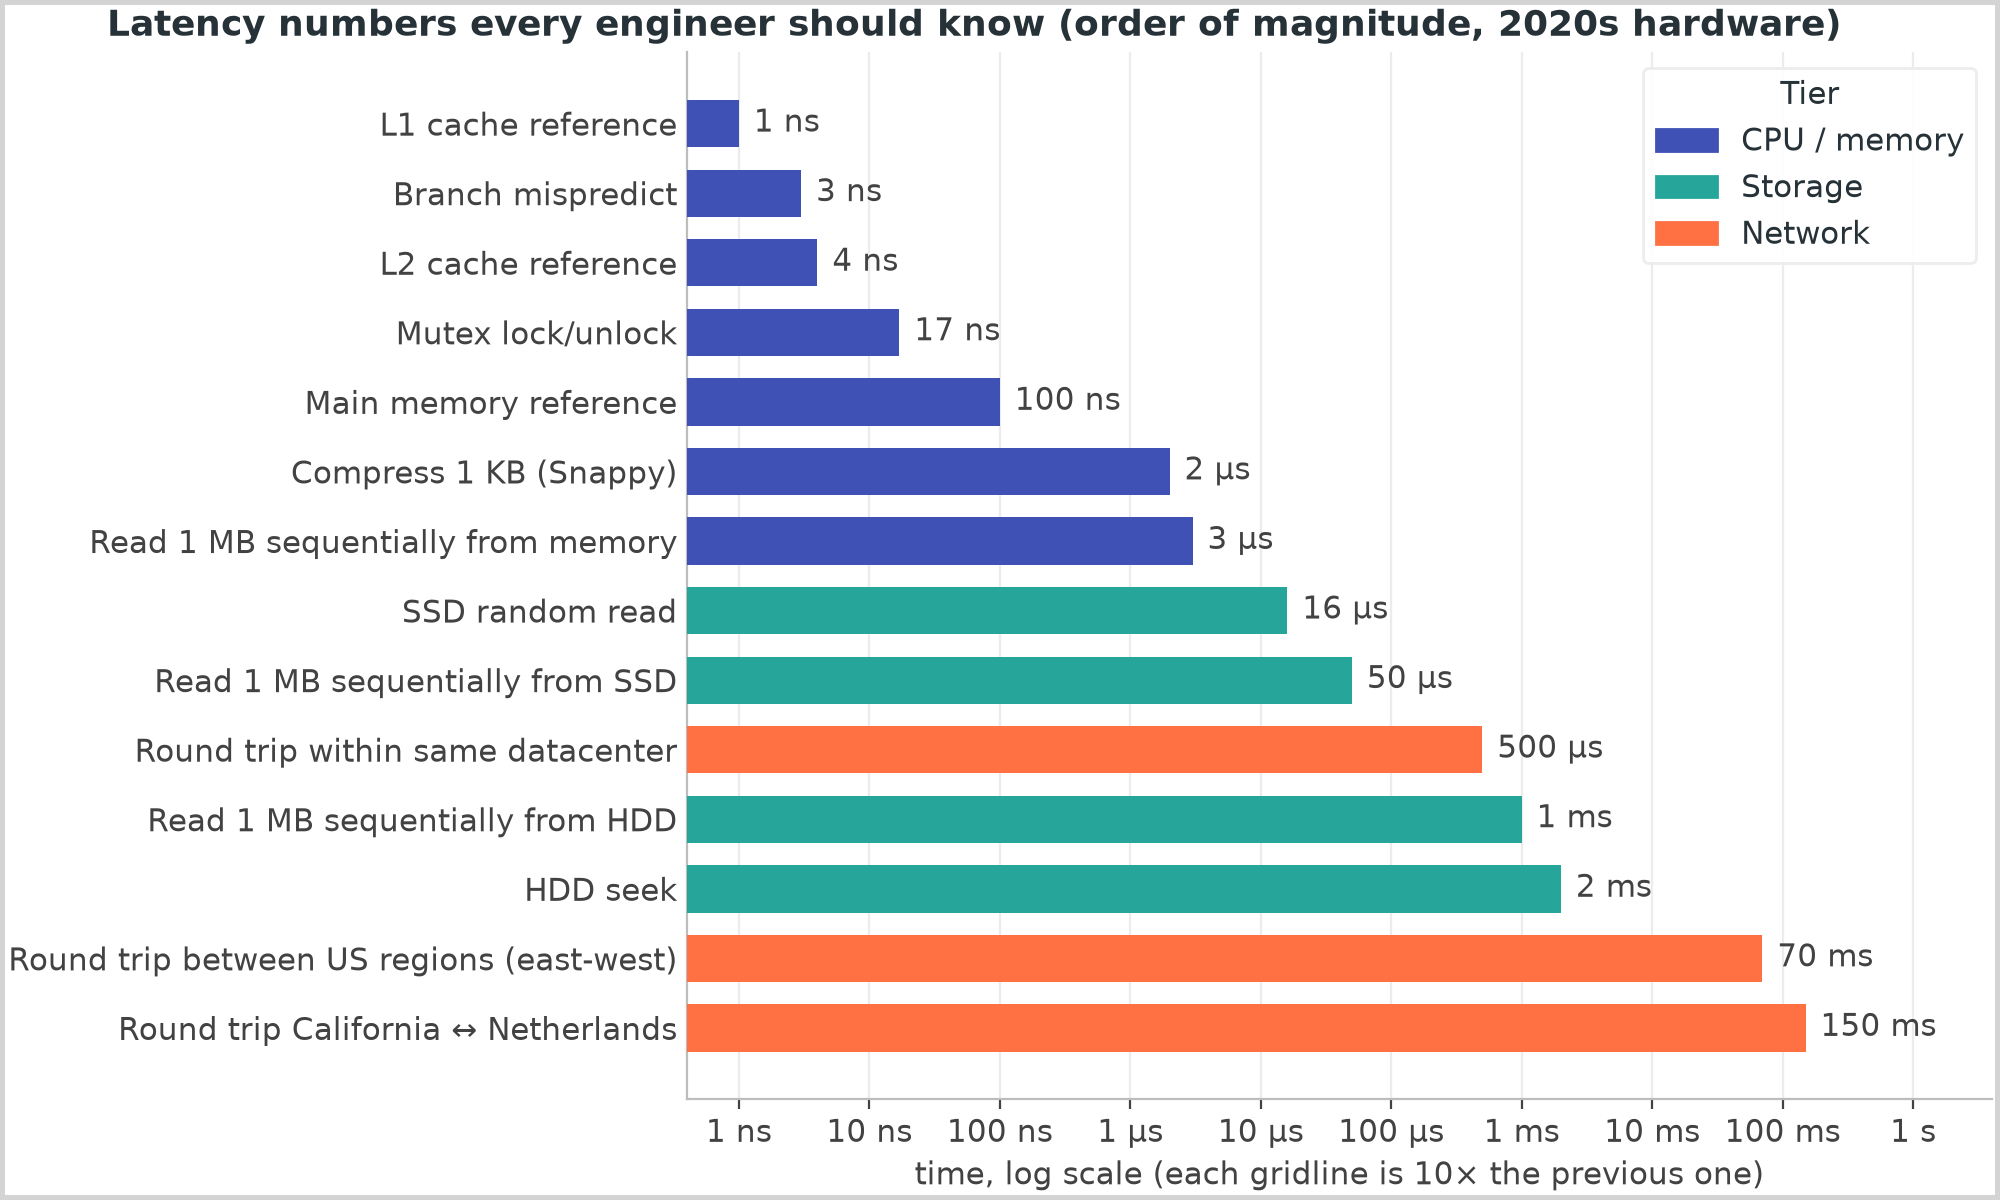
| Operation |
Typical |
Rule of thumb |
| L1 cache reference |
1 ns |
registers and L1 are "free" |
| Branch mispredict |
3 ns |
|
| L2 cache reference |
4 ns |
|
| Mutex lock/unlock (uncontended) |
17 ns |
a lock is cheap; contention is not |
| Main memory reference |
100 ns |
~100x slower than L1 |
| Compress 1 KB with Snappy |
2 µs |
compression is cheap relative to I/O |
| Read 1 MB sequentially from memory |
3 µs |
~300 GB/s effective |
| SSD random read (4 KB) |
16 µs |
~100k IOPS per device, NVMe can do 1M |
| Read 1 MB sequentially from SSD |
50 µs |
~2 GB/s |
| Round trip within the same datacenter |
500 µs |
the cost of any network call |
| Read 1 MB sequentially from HDD |
1 ms |
~100-200 MB/s sequential |
| HDD seek |
2 ms |
~100 random IOPS per disk |
| Round trip between US regions (east to west) |
70 ms |
|
| Round trip California to Netherlands and back |
150 ms |
speed of light in fibre: ~200 km per ms |
Consequences worth saying out loud: memory is ~1,000x faster than SSD for random access and ~100,000x faster than HDD; a single cross-region call costs more than a thousand cache hits; a disk seek costs more than compressing a megabyte.
Powers of two
| Power |
Exact |
Approximate |
Name |
| 2^10 |
1,024 |
1 thousand |
1 KB |
| 2^20 |
1,048,576 |
1 million |
1 MB |
| 2^30 |
1,073,741,824 |
1 billion |
1 GB |
| 2^40 |
~1.1 x 10^12 |
1 trillion |
1 TB |
| 2^50 |
~1.1 x 10^15 |
1 quadrillion |
1 PB |
Data sizes: int 4 B, long/timestamp 8 B, UUID 16 B (36 chars as text), ASCII char 1 B, UTF-8 char 1-4 B, IPv4 4 B.
Availability: nines to downtime
| Availability |
Downtime per year |
Downtime per month |
Downtime per day |
| 99% (two nines) |
3.65 days |
7.3 hours |
14.4 minutes |
| 99.9% (three nines) |
8.76 hours |
43.8 minutes |
1.44 minutes |
| 99.95% |
4.38 hours |
21.9 minutes |
43 seconds |
| 99.99% (four nines) |
52.6 minutes |
4.38 minutes |
8.6 seconds |
| 99.999% (five nines) |
5.26 minutes |
26.3 seconds |
0.86 seconds |
Serial dependencies multiply: two 99.9% services in series give 99.8%. Redundant dependencies in parallel: 1 - (0.001 x 0.001) = 99.9999%.
Time conversions for quick math
| Period |
Seconds |
Use in your head |
| 1 day |
86,400 |
10^5 (round up; then multiply QPS by 1.15 if precision matters) |
| 1 month |
2.6 million |
2.5 x 10^6 |
| 1 year |
31.5 million |
3 x 10^7 |
| Quantity |
Formula |
Notes |
| Average QPS |
daily requests / 86,400 |
1M requests/day ~ 12 QPS; 100M/day ~ 1.2k QPS |
| Peak QPS |
2-5 x average |
use 3x unless told otherwise; events can be 10x |
| Read QPS |
write QPS x read/write ratio |
typical ratios: 10:1 (social), 100:1 (URL shortener), 1:1 (chat) |
| Storage per year |
writes/day x object size x 365 |
add replication factor (x3) for raw disk |
| Bandwidth |
QPS x payload size |
10k QPS x 10 KB = 100 MB/s = 0.8 Gbps |
| Cache size (80/20 rule) |
20% of daily reads x object size |
100M reads/day x 1 KB x 0.2 = 20 GB |
| Servers needed |
peak QPS / QPS per server, then x1.5-2 headroom |
see capacity table |
Capacity rules of thumb (per node, order of magnitude)
| Component |
Sustained capacity |
Caveat |
| Stateless app server (business logic) |
~1k QPS |
10k+ for trivial work or proxies |
| Nginx / L7 load balancer |
~10k-100k QPS |
depends on TLS and payload |
| PostgreSQL / MySQL single primary |
~5k-20k writes/s, 50k+ indexed reads/s |
one box; read replicas for reads |
| Redis (single instance, single-threaded) |
~100k ops/s |
pipelining raises it; memory-bound |
| Memcached |
~200k+ ops/s |
|
| Cassandra / DynamoDB (per node or partition) |
~5k-10k writes/s per node; DynamoDB 1k WCU / 3k RCU per partition |
linear scale-out |
| Kafka broker |
~100 MB/s in, ~1 GB/s out (batching, page cache) |
partitions scale parallelism |
| Elasticsearch data node |
~5k-10k docs/s indexing |
query cost varies widely |
| SSD (NVMe) |
~100k-1M random IOPS, ~2-7 GB/s sequential |
|
| HDD |
~100 IOPS, ~150 MB/s sequential |
|
| Long-lived connections (WebSocket) per node |
~100k stateful, ~10k-50k if the node also holds session state |
tune-dependent; state the figure you assume |
| 10 Gbps NIC |
1.25 GB/s |
25/100 Gbps common in datacenters |
| Server memory / disk |
64-512 GB RAM, 2-20 TB disk |
|
Typical object sizes
| Object |
Size |
Object |
Size |
| Short URL record (URL + metadata) |
~100-500 B |
Text post / tweet with metadata |
~1 KB |
| Chat message |
~100 B-1 KB |
User profile row |
~1 KB |
| JSON API response |
1-10 KB |
Log line |
200 B-1 KB |
| Thumbnail |
20-50 KB |
Compressed photo |
200 KB-2 MB |
| 1 minute of 1080p video (~10 Mbps) |
~75 MB (say 50-100 MB) |
1 minute of 4K video |
~350 MB |
| Raw metric data point |
16 B (timestamp + value) |
Compressed metric point (Gorilla) |
~1.4 B |
Worked one-liners
| System |
Given |
Result |
| URL shortener writes |
100M new URLs/day |
100M / 10^5 = ~1.2k writes/s; peak ~3.5k |
| URL shortener reads |
100:1 read ratio |
~120k reads/s average; cache 20% of 10B reads x 500 B ~ 1 TB/day of hot data (so cache the hottest few GB) |
| URL shortener storage |
100M/day x 500 B x 365 x 10 years |
~180 TB (x3 replication ~550 TB) |
| Twitter-like writes |
300M DAU x 0.5 tweets/day |
150M tweets/day ~ 1.7k TPS; peak ~5k |
| Twitter-like reads |
300M DAU x 50 timeline reads/day |
15B reads/day ~ 175k QPS; peak ~500k |
| Twitter-like media storage |
10% of tweets carry 1 MB media |
15M x 1 MB = 15 TB/day; text 150M x 1 KB = 150 GB/day |
| YouTube uploads |
5M DAU x 10% upload 1 video/day x 300 MB |
500k videos/day x 300 MB = 150 TB/day raw; transcoding multiplies it |
| Chat fan-out |
50M DAU x 40 messages/day |
2B messages/day ~ 23k msg/s; peak ~70k; storage 2B x 100 B = 200 GB/day |
| Metrics ingestion |
10M servers? no: 100k hosts x 100 metrics x every 10 s |
1M points/s; 16 B raw = 16 MB/s, ~1.4 TB/day raw, ~120 GB/day compressed |
Memory hooks
- "Day = 10^5 seconds." 1M/day is ~10 QPS; 100M/day is ~1k QPS; 10B/day is ~100k QPS.
- "Memory to SSD to HDD to network: 100 ns, 100 µs, 10 ms, 100 ms." Each hop is two to three orders of magnitude.
- "Three nines is eight hours a year; four nines is an hour."
- "Peak is 3x average; cache 20% of the data for 80% of the hits."
- "A thousand QPS per app server, a hundred thousand per Redis."
- Round, then sanity-check: 150M tweets/day at 1 KB is 150 GB/day, which is ~55 TB/year — fits on a handful of machines; media does not.
- Back-of-envelope estimation — the method and worked examples in depth
- The 45-minute HLD framework — where estimation sits in the round
- Caching and CDNs — turning the 80/20 rule into a cache size
- Primary sources: Jeff Dean's "Numbers Everyone Should Know" (2010), Colin Scott's interactive update (2020), Brendan Gregg's Systems Performance latency tables